Frank Costa – Manager, System Integration Services
Bob Sloma – Digital Transformation SME
In our last post in this series, we described the first three levels of the Sandalwood IIOT4Free open-source technology stack: data generation; data capture and abstraction/normalization; and data collection/acquisition. Next, we will look at the next three levels of this tech stack: historical data ingestion, data analysis and contextualization; visualization, analytics and business intelligence; and client-side dashboards.
Historical Data Ingestion, Data Analysis, & Contextualization
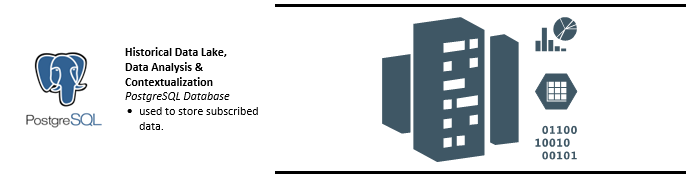
Incoming data from the Data Collection/Acquisition level is stored in either a relational or NOSQL database. As data flows into the requisite database, internal processes and procedures can be run to segment and parse data based on programmed analytics requirements, such as basic aggregation or association linkages across disparate data sources. Concurrently, data can also be parsed to give context (or meaning) to the incoming data; an example of this type of parsing includes assigning and/or linking units to inbound telemetry data. This staging of data can be used to expedite expected reporting and data analysis models.
The telemetry data should be left as unadulterated as possible to allow the subsequent data layer the ability to freely analyze all available data. Historical data ingestion can be conducted in an on-prem or cloud-based environment.
In our implementation, another connector, written in Python, is used to subscribe to a MQTT topic level (line, machine), processes the data within the MQTT payload, and writes the data to a PostgreSQL database table. The MQTT to PostgreSQL connector configuration requires:
- The MQTT broker hostname/IP address and port.
- A unique MQTT client ID.
- The MQTT topic(s).
- The relevant data to connect to a PostgreSQL database and table.
If the table does not exist, the connector will automatically create it based on the first message it receives, and it will add table columns when messages come in with new attributes (keys/tags) with associated data.
Visualization, Analytics, & Business Intelligence
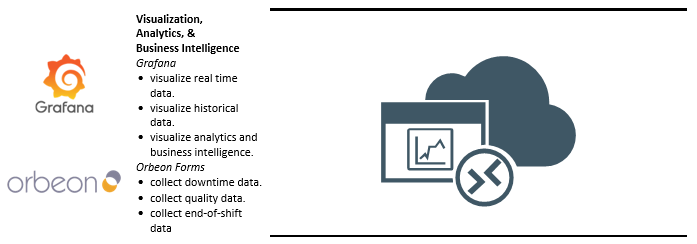
At this level with the definition of expected parameter norms as well as rule sets, the incoming data stream can be compared to these definitions and alert end users of abnormal or anomalous data. The visualization engine can also display data from both historical and real-time channels.
The real-time channel contains data that can be viewed in dashboard-type interfaces. This type of data shows what is occurring in the present with as little latency as possible. While these dashboards may contain data aggregations or calculations, those pieces of data are produced via the historical channel (usually over time or some other attribute, sometimes provided by the real-time channel).
The historical channel is used to aggregate and display data that has already transpired, such as production reports over time, process control charts, birth history reports, etc. Business intelligence or AI modules can be applied at this level to combine historical models and real-time information to output decisions based on both. Typically, the Historical Data Ingestion; Data Analysis, Contextualization and Visualization; and Analytics & Business Intelligence layers are run on two different pieces of hardware in an on-prem environment.
Client-Side Dashboards

Dashboarding represents the end user front-end interface. These can be expressed as:
- Data analysis portals
- Real-Time dashboards
- Physical or electronic reports
- Autonomous alerting based on established rule sets.
Autonomous alerting can originate at the Historical Data Ingestion, Data Analysis & Contextualization layer onward. It can also potentially output to other systems via REST APIs, connectors to ERP systems, etc.
Conclusion
IIOT4Free is an open-source technology stack developed by Sandalwood that can be used by small to medium-size manufacturers to explore the opportunities present in utilizing IIoT within their production environments. The tech stack provides an end-to-end solution for collecting data from a small number of machines and devices, storing it within a historical database, and displaying information on web-based dashboards. As the value of the IIoT technology is proven, the various parts of the tech stack can eventually be further enhanced and built upon with paid out-of-the-box solutions. IIOT4Free is a good first step in your digital transformation journey.


 Why Sandalwood?


 We are a one-stop-shop for launching job rotation for any employer from conception to implementation. Our experts tailor our services to meet the needs of our customers by collaborating with them throughout the entire process. We do not offer cookie cutter solutions for job rotation because the needs of employers vary significantly.
 Why Sandalwood?


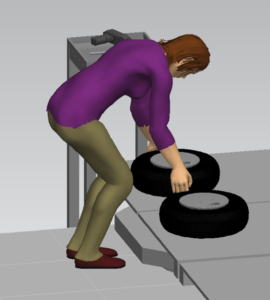
 Sandalwood is pleased to offer solutions above and beyond the traditional ergonomic assessments. With an in-depth knowledge of various digital human modelling software suites, integration and adoption to your health and safety programs has never been easier. Sandalwood is experienced in ergonomic program design as well as industry leaders in digital human modelling services. We have a diverse team that is able the leverage the results from the digital human model to provide in depth risk assessments of future designs and current state. Sandalwood is also able to pair these assessments with expertise and provide guidance on the best solution for you. Sandalwood is also on the forefront of emerging technologies and able to integrate Motion capture, Wearables, and extended or virtual reality into your ergonomic program.