Volume 3 | March 2022
QUARTERLY REVIEW
Human-Centered. Solutions Driven.
-
Inside This Issue
Why the Human Factor is Critical to Success: A Deep Dive into the Human Centered Model
REGULAR FEATURES
ON OUR RADAR: A Dashboard Designed for Success with HCD
By Bob Sloma & Chelsea Anderson
Why do so many companies fail when they are looking for continuous improvement in the development of new systems to improve throughput, quality, and operator safety? They fail because the new processes are centered around technology and not around the user.
To prevent this common error, our goal is to incorporate the Human Center Design (HCD) approach in the development of different computer interfaces and systems. By using this approach to solutions, we will ensure our systems support our user’s goals and constraints while eliminating potential design and usability problems. The problem we see when the HCD approach is not implemented is that users are subjected to user frustration, workarounds, user error, increased mental workload, and more.
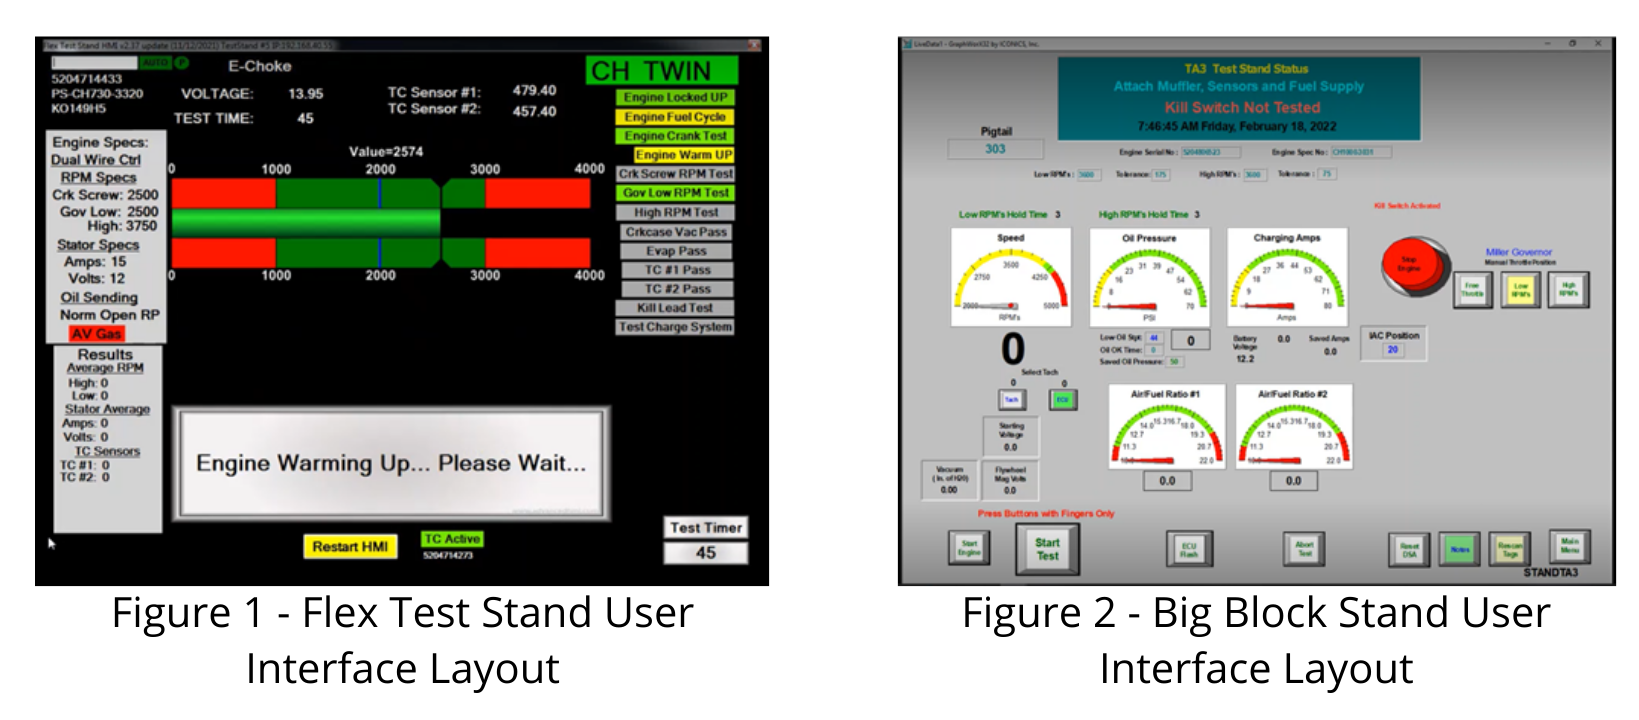
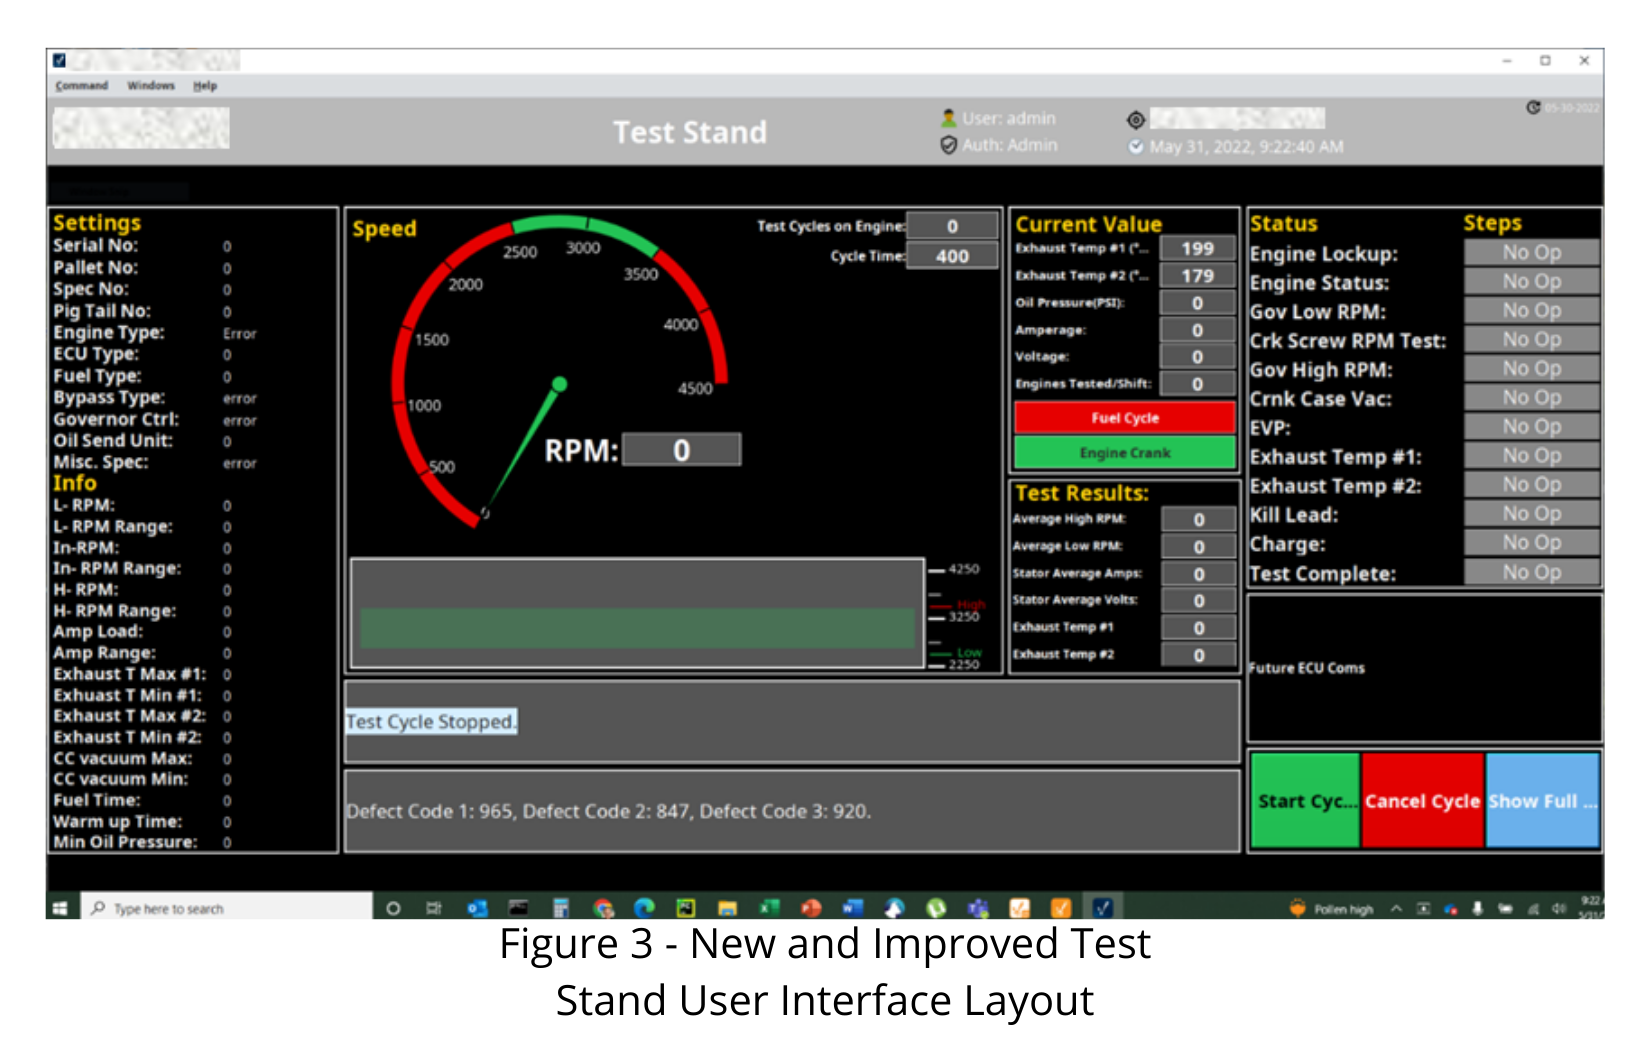
HCD is a solution factor in many of our projects including a recent project we completed to enhance the design layout of a client’s dashboard. Given the previous dashboard design layouts shown in Figures 1 & 2, our client requested assistance to redesign their engine test software system into one interface incorporating features from the flex test stand and big block test stand interfaces. As part of our process, we were able to clearly capture our client’s goals for the project. Using our HCD solutions and after consultation with the client, a new design layout for the engine test dashboard (Figure 3), was created.
A primary goal of the new layout was to improve the user experience. Given the previous dashboard design layouts (Figure 1 & Figure 2), our client requested assistance to redesign their engine test software system into one interface incorporating features from the flex test stand and big block test stand interfaces. As part of our process, we were able to clearly capture our client’s goals for the project. Using our HCD solutions and after consultation with the client, a new design layout for the engine test dashboard (Figure 3) was created. A primary goal of the new layout was to improve user experience. A solution to this was creating a layout containing only the relevant information needed by the user (another finding from our consultation process).
The Human Centered Design approach to the consultation revealed users only needed to actively track the engine’s RPM during testing. Given this point, the new design only provides a visualization for the RPM, which supports the user’s goal. The visual display is a replica of a car odometer, which is a universal visual that is connected to speed and makes the visualization match a real-world concept. By simplifying the design, the dashboard now only includes information needed to confirm a successful or failed testing cycle. Outlined boarders were also implemented in the new design to create division between the information presented on the interface. This minimizes user confusion by including physical distinctions and spatial separation between the distinct groups of information, not included in the older versions. Each section is also successfully labeled to inform the user of the type of information included in the section.
When designing user interfaces, it’s also important to consider the human’s working memory limits. The status section of the new improved test stands interface embodies this because it was designed to maintain congruence between the order of text and order of action. When the test is running, the test begins by locking up the engine and proceeds with the following tasks below in sequential order. The test status displayed on the right side follows the same sequential order as the text and doesn’t move to the next step without the completion of the previous step. By doing this, we also provided the users with a visible reminder of what else needs to be done during the engine test.
Now tailoring the interface design around human’s visual sensory system, we continued to use the color scheme as shown in Figure 1 for the new improved test stands user interface layout (Figure 3) because of the great color contrast between the background and the text. By incorporating a strong color contrast, users can quickly perceive the information presented on the interface. Without the strong color contrast, users are subject to an increased mental workload due to the interface not being readable or comprehensible between the two elements. This could create mental fatigue and decrease the user’s performance. The colors used in the new improved test stand user interface limits distractions and human errors, which is very important. The new improved test stand also uses redundant colors in each section of the layout to provide a consistent and standardized layout. Given these few key design implications, we were able to effectively improve the layout of our client’s dashboard.
By using the HCD approach, we put the operator at the center of system and work cell design. By taking into consideration the operator’s working memory limitations and using color contrast and screen element positioning effectively, we were able to successfully meet the client’s goals and improve user experience. By also being consistent with how information is displayed and how the operator will interact with the system, the operator can easily complete their work tasks with fewer errors and frustration. This leads to a better work environment for the operator on the production floor and improves production performance for the organization; a clear win-win proposition.


 Why Sandalwood?


 We are a one-stop-shop for launching job rotation for any employer from conception to implementation. Our experts tailor our services to meet the needs of our customers by collaborating with them throughout the entire process. We do not offer cookie cutter solutions for job rotation because the needs of employers vary significantly.
 Why Sandalwood?


 Sandalwood is pleased to offer solutions above and beyond the traditional ergonomic assessments. With an in-depth knowledge of various digital human modelling software suites, integration and adoption to your health and safety programs has never been easier. Sandalwood is experienced in ergonomic program design as well as industry leaders in digital human modelling services. We have a diverse team that is able the leverage the results from the digital human model to provide in depth risk assessments of future designs and current state. Sandalwood is also able to pair these assessments with expertise and provide guidance on the best solution for you. Sandalwood is also on the forefront of emerging technologies and able to integrate Motion capture, Wearables, and extended or virtual reality into your ergonomic program.